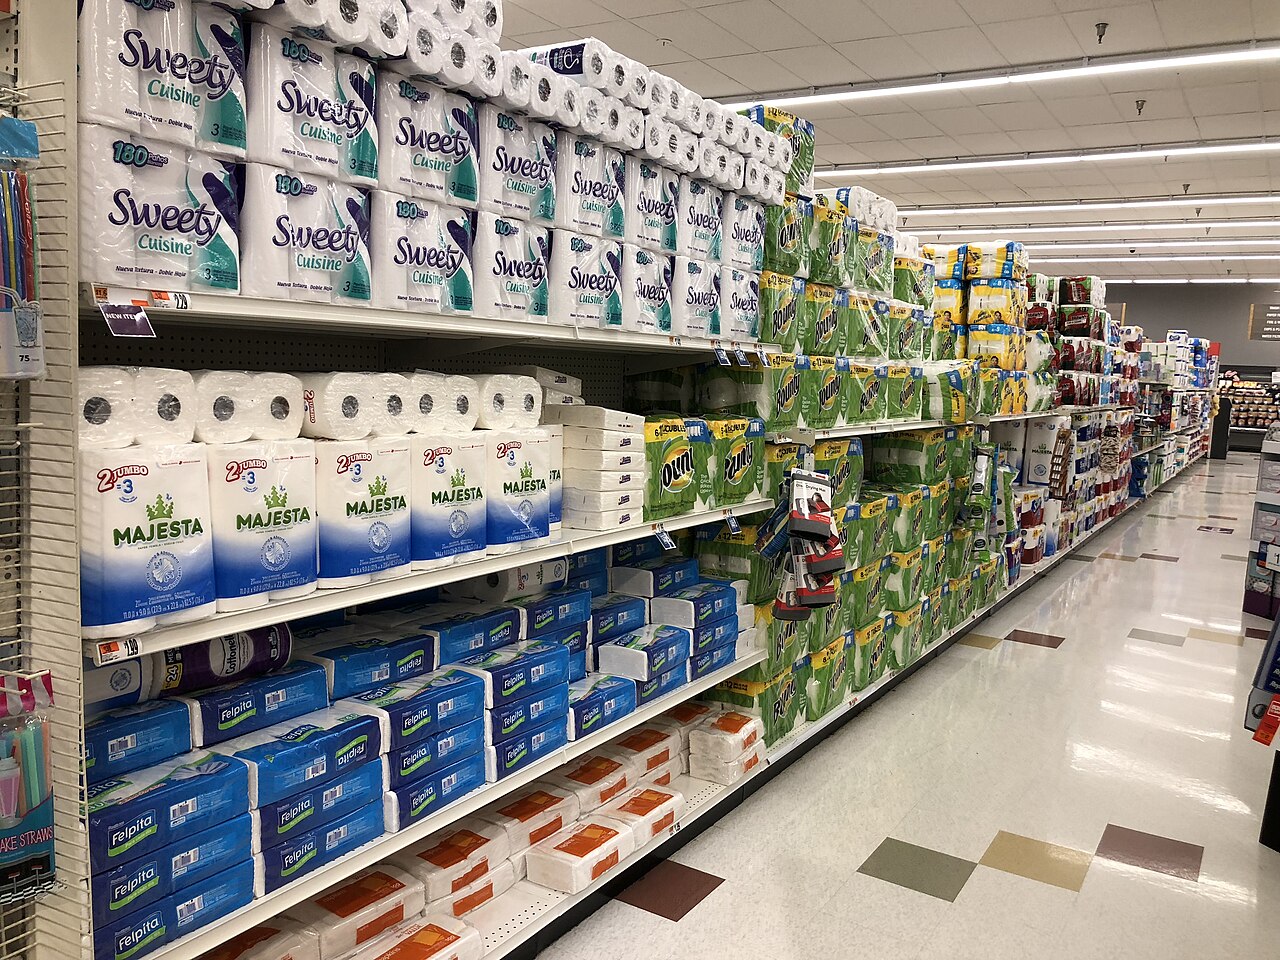

The roll of paper towels runs out faster than it used to. The bag of chips has more air at the top. The price tag, meanwhile, has not moved, which is precisely the point. Selling a smaller amount for the same money is a price increase that most shoppers never register, and manufacturers know it: market research consistently finds consumers react more to a price change than to a size change.
The practice has a nickname, shrinkflation, and a formal name at the Bureau of Labor Statistics, downsizing. What many shoppers do not realize is that the government tracks it, counts it in the inflation numbers, and has published data on exactly which aisles it hits hardest.
What counts as shrinkflation
The mechanics are simple. A candy bar goes from 1.6 ounces to 1.5 ounces at the same price. A “half gallon” of ice cream quietly becomes 60 ounces. The number of sheets on a toilet paper roll drops from 220 to 200. In each case the register price is unchanged, but the price per ounce or per sheet rose. In a BLS analysis of shrinkflation, the agency works one example: a 64-ounce ice cream priced at $5.99 that shrinks to 60 ounces at the same $5.99 is a 6.7% increase in the price per ounce, and that sheet-count change on toilet paper works out to a 10% per-sheet increase.
Downsizing only works on products sold by the package. Goods priced by the pound or gallon, like gasoline or steak, cannot be shrunk without the price changing, which is why shrinkflation lives in the middle aisles of the grocery store rather than at the pump or the butcher counter. The reverse also exists: upsizing, the “bonus size” package with more product at the same price, though BLS finds it happens less often than downsizing.
How the government catches it
The Consumer Price Index prices roughly 100,000 goods and services every month, and BLS data collectors track the same specific items over time, recording attributes like weight, volume, and sheet count along with the shelf price. When a package shrinks, the collector reports the new size, and the index registers the change in effective price per unit, not the unchanged register price. In other words, shrinkflation does not sneak past the CPI; the 6.7% ice cream increase in the example above goes into the inflation numbers even though the shelf tag never moved.
BLS economists also run a research series that isolates the effect, the research CPI without product size changes, which recalculates inflation as if no package had changed size, with data beginning in December 2014. Comparing the two versions of the index is how we know what shrinkflation actually adds to the cost of living.
Which products shrink the most
Between 2015 and 2021, the category with the most size changes in the CPI sample was household paper products, with 716 reports of downsizing or upsizing, about 3% of all price observations in that category. Snacks led food items with 509 size changes, followed by sweet rolls and donuts, tea, and pies. Coffee, diapers, cakes, and candy also make the list. BLS notes the classic snack move: a 4.5-ounce chip bag becoming 4.25 ounces, or an 8-ounce bag slimming to 7.5.
The updated numbers, covering January 2019 through October 2023, show what that meant during the high-inflation years. Downsizing added about 3.6 percentage points to the measured price increase for household paper products over that span, 2.6 points for snacks, 2.1 points for candy and gum, and 1.6 points for coffee. Ice cream, cleaning products, and frozen prepared foods all show up as well.
And yet the overall effect is small
Here is the finding that surprises people who feel ambushed at the grocery store: across the whole CPI, shrinkflation barely moves the needle. Over 2015 to 2019, product size changes raised the all-items commodities and services index by about 0.01% per year on average, with food and beverages the most affected major group at roughly 0.2 percentage points over the full five years.
Both things are true at once. Shrinkflation is real, concentrated, and measurable in the snack and paper aisles, and it is a rounding error on total inflation, because most of what households buy, from rent to gasoline to medical care, cannot be downsized. The frustration it produces comes less from the dollars than from the feeling of being fooled.
The shopper’s defense is printed on the shelf
You do not need to memorize sheet counts. Nearly every supermarket shelf tag shows a unit price, the cost per ounce, per sheet, or per 100 count, in small print beside the big price, and it is the one number downsizing cannot hide from. Comparing unit prices across brands and package sizes catches a shrunken package instantly, and it also exposes the opposite trap, the “family size” box that costs more per ounce than the regular one. BLS explains how it handles size and quality changes in its CPI quality adjustment documentation; the shelf tag is the household version of the same idea. The package design is aimed at your eye. The unit price is aimed at your budget, and it takes about two extra seconds to read.
This article was produced with AI assistance and reviewed by a human editor. Figures are linked to their primary sources; where a claim could not be verified from the public record, we say so.
Leave a Reply