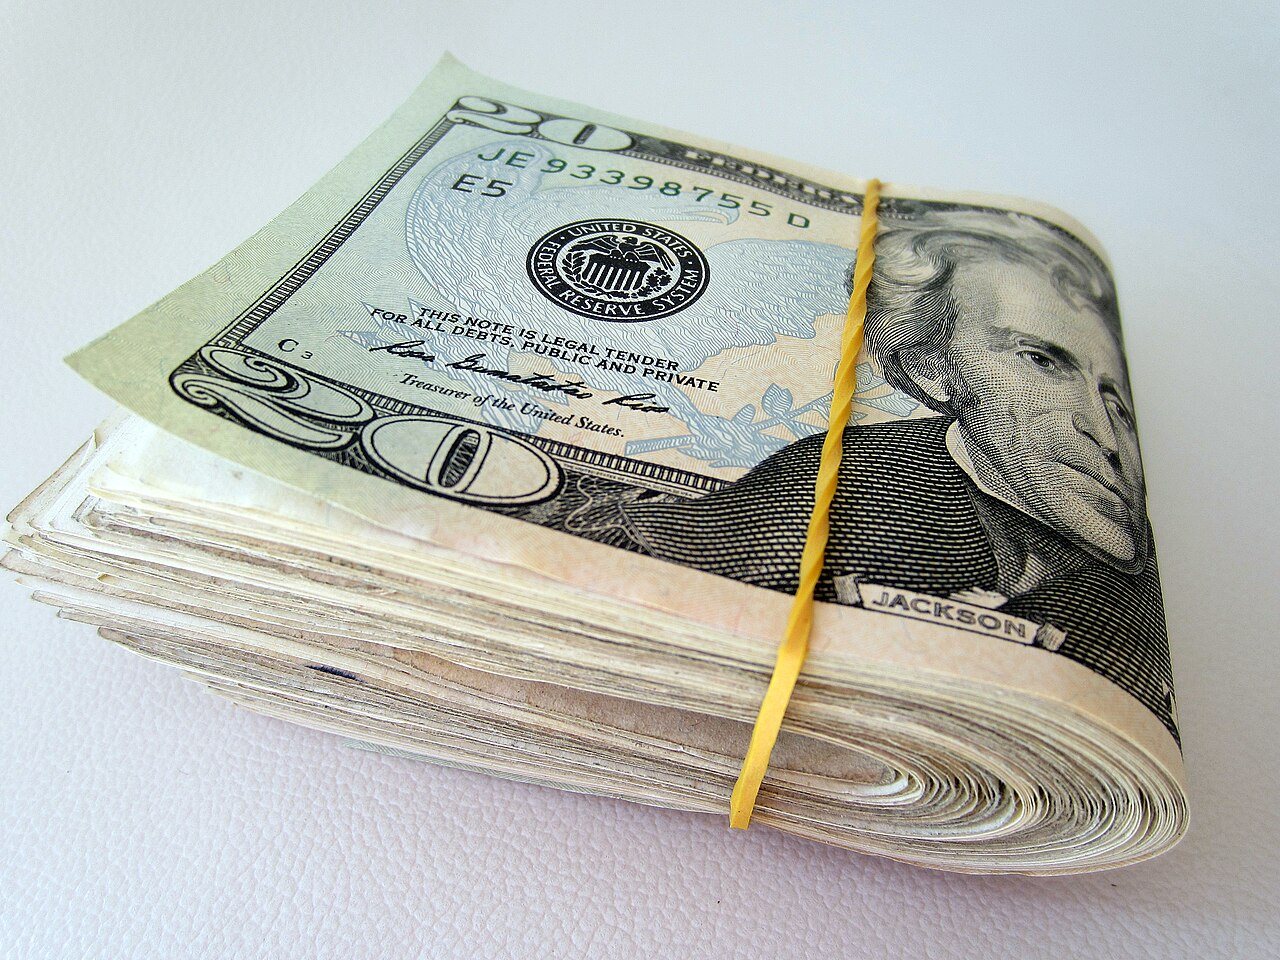

The average private-sector worker in the United States earned $37.38 an hour in March. Twelve months earlier, the same average stood at $36.11. That works out to a raise of 3.5 percent, and on paper it looks like real progress, according to the Bureau of Labor Statistics report on real earnings released April 10.
Paychecks are not spent on paper, though. Over those same twelve months, the Consumer Price Index rose 3.3 percent. Once you strip out higher prices, the average worker’s hourly pay gained just 0.3 percent in real purchasing power over an entire year. That gap, between the raise you can see on a pay stub and the raise you can actually spend, is why so many households feel like they are treading water while wages climb.
Nominal pay versus real pay
Economists call the number on your pay stub your nominal wage. Your real wage is what that money buys after inflation, and it is the figure that decides whether your standard of living is rising or falling. Every month, BLS publishes both in its Real Earnings report: it takes average hourly earnings from the payroll survey and deflates them with the Consumer Price Index.
The deflated numbers are expressed in constant 1982 to 1984 dollars, which makes them look small but comparable across time. In those terms, the average hourly wage was $11.32 in March 2026 versus $11.29 in March 2025. A year of raises, netted against a year of price increases, bought the average worker about three constant-dollar cents an hour.
What happened in March, line by line
The month-to-month story was worse than the annual one. From February to March, average hourly earnings rose 0.2 percent, a perfectly ordinary gain. But the CPI jumped 0.9 percent in a single month, so real average hourly earnings fell 0.6 percent. The average workweek also slipped 0.3 percent, from 34.3 hours to 34.2, which pushed real average weekly earnings down 0.9 percent in one month.
In plain dollars, average weekly earnings were $1,278.40 in March, slightly below February’s $1,279.05, even though hourly pay went up. Fewer hours at a similar rate means a smaller check, and higher prices mean the smaller check buys less. Over the full year, real weekly earnings managed a gain of just 0.2 percent.
Front-line workers were squeezed a little harder
BLS tracks a second group: production and nonsupervisory employees, the roughly four-fifths of private payroll jobs that exclude managers. Their average hourly wage was $32.07 in March. The price index used for this group, the CPI-W, rose 1.1 percent in March alone, so their real hourly earnings fell 0.9 percent over the month.
Over the year, this group’s real hourly earnings rose just 0.1 percent, even less than the all-employee figure. Workers closer to the median wage typically spend a larger share of income on gasoline, groceries, and rent, the categories where price swings hit hardest, so a month like March lands on them with more force.
One hot month can absorb a year of progress
As recently as February, real hourly earnings were up 1.3 percent over the prior year. One month later, that annual gain had shrunk to 0.3 percent. The culprit was the March CPI itself, which rose 0.9 percent over the month and 3.3 percent over the year, with energy prices, and gasoline in particular, doing much of the damage.
This is the nature of the real-earnings math: wages tend to move in slow, steady steps, while prices can lurch. Over the past five years, the 12-month change in real average hourly earnings has ranged from a 3.4 percent loss in April 2021, deep in the post-pandemic inflation surge, to a 1.8 percent gain in March 2025. Workers spent most of 2021 through early 2023 losing ground in real terms even while nominal raises looked historically generous.
How to run this math on your own paycheck
The check is simple. Take your current pay and your pay from twelve months ago, and figure the percentage increase. Then compare it with the 12-month change in the CPI, which was 3.3 percent through March. If your raise beat that number, your buying power grew. If it did not, you took a real pay cut, whatever the congratulatory email from human resources said.
The dollar version is sobering. The average weekly paycheck grew about $43 over the year, from $1,234.96 to $1,278.40. With prices up 3.3 percent, roughly $41 of that $43 went to paying more for the same goods and services. Call it two dollars a week of genuine progress. The BLS inflation calculator will do the conversion for any dollar amount and any pair of months, and it is a useful reality check before you decide whether an offer or a raise is actually a step up.
What to watch next
The April figures arrive on May 12, when BLS publishes the next Real Earnings report alongside the April CPI. The question for the spring is whether March’s energy spike was a one-month event or the start of a longer squeeze. If gas prices settle back, the annual real-earnings number could recover quickly, since the underlying wage growth of around 3.5 percent has not changed. If prices keep climbing at March’s pace, then this year’s raises will keep evaporating between the pay stub and the checkout line.
This article was produced with AI assistance and reviewed by a human editor. Figures are linked to their primary sources; where a claim could not be verified from the public record, we say so.
Leave a Reply